The much-awaited United Nations Climate Change Conference COP26 was held at Glasgow in November 2021. Around 120 leaders from countries around the globe deliberated on addressing the urgent climate-related risks and agreed that countries must do much more to combat this global challenge. Many nations announced their commitments towards accelerating their energy transition agendas and adopting clean energy sources across all spheres of activity including power, transport, and industries to achieve net-zero emissions.
The International Energy Agency (IEA) has prepared a Net Zero Emissions by 2050 Scenario (NZE), which is a model for the global energy sector to achieve net-zero CO2 emissions by 2050. The IEA also released its Tracking Clean Energy Progress (TCEP) report, which assesses the status of various critical energy sectors and gives suggestions on how they can transition to net zero. This article will summarise the key findings of IEA’s TCEP report across three sectors – renewable energy with a focus on solar and wind, and energy storage.
Renewable energy
Installed capacity and generation
Renewable electricity generation rose by 7 percent in 2020, with the share of renewables in the global electricity generation mix reaching close to 29 percent. Wind and solar power were responsible for almost 60 percent of this increase. A key growth driver for this impressive rise in renewable energy generation was the drop in power demand across the world owing to Covid-19, along with a slowdown in economic activity. This was complemented by the impressive capacity additions in the renewable energy space in 2020, which increased by 46 percent from 2019 to 2020 despite the pandemic.
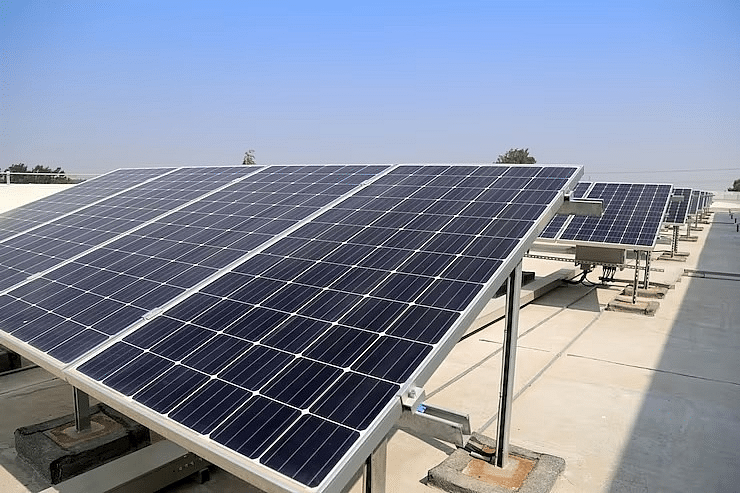
The global wind capacity additions increased by an exceptional 192 percent in 2020, with 108 GW of new capacity deployed. The offshore wind segment witnessed 6 GW of capacity additions. The total energy generation from wind power rose by 12 percent in 2020 as compared to 2019. Meanwhile, solar PV installations had another landmark year with 135 GW of new capacity added in 2020, a 25 percent increase over 2019.
Key wind power markets
The wind power capacity deployment in 2020 was almost double the capacity installed in 2019. This growth can be largely attributed to two markets – the US and China – which made up 79 percent of the total new installations, driven by the need to comply with support scheme deadlines. In the offshore wind space, almost half of the new capacity additions were in China, while the remaining were in Europe.
China’s onshore wind capacity reached nearly 69 GW in 2020 given the rush to complete the projects allocated under the country’s feed-in tariff (FiT) and auction schemes by the end of the year. In the US too, there was a rush to complete projects before the expiry of the production tax credit. Thus, 17 GW of onshore wind development was witnessed in the country in 2020. However, due to the lack of generous support schemes for new projects, capacity additions in both these countries are likely to decrease in the coming years.
While 8 GW of capacity was installed in Europe in 2020, the region is likely to witness accelerated growth in the coming years owing to a greater focus on climate targets. Meanwhile, India suffered a severe decline in wind capacity additions owing to pandemic-led construction delays, land acquisition issues, and transmission constraints.
In the offshore wind space, China and Europe witnessed some development. Various new markets are emerging in this space, with projects in advanced stages of development. For instance, projects have been proposed in four different states in the US. Similarly, a 5.5 GW auction has been completed in Taiwan with power purchase agreements (PPAs) signed for 1 GW of projects. However, issues like grid connection, high costs, and approvals and permits might delay projects in emerging markets, and thus, must be addressed in a timely manner with the right policies.
Key solar power markets
Like wind power, the expiry of support schemes in key markets – China, Vietnam, and the US-led to significant solar capacity deployments in 2020. Again, China took the lead, contributing to 75 percent of the total solar PV deployment in 2020. China installed a massive 48 GW in 2020 to complete projects before the shift in the policy regime towards lower incentives. However, even then, 40 GW of subsidy-free capacity is under development and the government’s 14th Five-Year Plan is expected to further accelerate project deployment with its new targets and cost reductions.
In the US, 19 GW of solar power capacity was deployed in 2020. The country is likely to witness strong growth in the utility-scale solar space with high demand expected from residential and commercial markets through corporate PPAs. Solar PV capacity increased by 15 percent in Europe in 2020, with Germany (+5 GW), Spain (+3 GW), the Netherlands (+3 GW), and Poland (+2 GW) emerging as the largest markets. In South America, Brazil installed more than 3 GW in 2020 and this momentum is likely to continue owing to attractive net metering incentives.
India witnessed a slowdown in capacity additions with less than 4 GW of solar PV capacity deployment owing to delays in project completion due to supply chain, construction, and logistics disruptions. However, these limitations are temporary and capacity additions are expected to increase in the coming years with government targets and auctions.
Further, Vietnam saw 11 GW of solar capacity additions, much higher than what it witnessed in 2019 owing to the country’s FiT scheme. Interestingly, the 2020 solar deployment surge was largely due to distributed solar, unlike the year 2019, which saw massive utility-scale solar installations. However, the coming years might witness a slowdown in growth due to system integration challenges.
Policy regime and recommendations
Various policy interventions depending on technological maturity have been undertaken to promote renewable power deployment. These include FiTs or premiums, renewable portfolio standards, green certificate schemes, net metering, tax rebates, and capital grants. Lately, auctions have become a more popular way to allocate projects and discover competitive prices, especially in the case of solar PV and wind power.
However, the rapid development of cost-competitive solar and wind power projects across the world has created some challenges for power systems at the grid level. Thus, policy and market frameworks need to be designed to accommodate the high volumes of variable renewable energy in a reliable manner into the grid. The flexibility of power systems needs to be maintained to ensure stable grids. The IEA recommends the following policies that ensure investment in flexibility enhancement of power systems:
- The operation of the existing conventional power plants, especially reservoir hydropower plants, should be made more flexible.
- Demand-side management measures should be adopted.
- Energy storage including pumped hydropower storage should be promoted.
- Grid infrastructure should be enhanced.
To meet the NZE by 2050 Scenario of more than 60 percent renewable energy contribution in the energy mix by 2030, the renewable energy capacity needs to be further expanded. In fact, renewable power generation must increase at an average annual rate of 12 percent in this decade, which is almost twice that in the past decade.

Installed capacity and growth
Battery storage installations across the world increased by 50 percent in 2020 over 2019 to reach roughly 17 GW as of the end of 2020. Roughly 5 GW of new storage capacity was brought online in 2020, largely dominated by utility-scale installations, which contributed two-thirds of the total added capacity. China and the US, with GW-scale deployments, took the lead in the energy storage space.
Overall, $5.5 billion of investments were made in battery storage in 2020, an increase of almost 40 percent from 2019. The growing uptake of grid-scale batteries in renewable energy projects led to significant investments in this space. Meanwhile, there was a decline in investments in behind-the-meter storage used in small businesses and residences. In terms of technology, lithium-ion battery storage continues to dominate the market.
Key markets
China witnessed a doubling of capacity additions in 2020 owing to a strong demand in grid integration of renewable energy projects. This momentum is likely to continue as China announced plans to install 30 GW of energy storage by 2025, a tenfold increase in its present capacity. Capacity additions increased significantly in the US in 2020 owing to utility-scale projects, specifically two large projects in California. Further, a two-year extension was given in December 2020 to the solar investment tax credit that benefits solar plus storage installations and the Better Energy Storage Technology Act.
Europe, meanwhile, saw a decline in utility-scale installations and expansion in residential deployments, with Germany emerging as the leading market in behind-the-meter installations. In addition, the National Grid Electricity System Operator in the UK launched its dynamic containment frequency response service, which creates many opportunities for the installation of fast response battery-based energy storage devices.
Other countries in the Asia Pacific also witnessed an increase in the uptake of energy storage devices. Korea saw a significant increase in deployments, which is not likely to continue owing to the expiry of federal subsidy schemes. Meanwhile, Japan and Australia continued to witness strong growth in behind-the-meter storage installations. In the case of Australia, utility-scale deployments are expected to increase in the coming years.
Global energy storage deployment is set to increase over the coming years owing to the announcement of several major policies and projects. Further, the rapid scale-up of solar and wind power projects will create many opportunities for the massive deployment of energy storage systems, which will help address the intermittency of solar and wind power. The formulation of regulations and creation of markets for flexibility and ancillary services will become critical to promote energy storage along with support schemes like mandates and incentives.
Conclusion
Renewable energy projects, dominated by wind and solar, will continue to increase rapidly owing to policy interventions as well as cost economics. Energy storage is taking center stage in the power sector with many applications ranging from consumer-led deployment to grid stability. Thus, smarter grids with a high degree of automation can help in the effective management of increasingly complex power systems. Further, green hydrogen needs to be massively scaled up for greater synergies and carbon emission reduction.
Overall, with power, transport, heating, and cooling sectors becoming interlinked, regulatory and market mechanisms need to be created to ensure the growth of clean technologies across the entire energy ecosystem.